Topological Data Analysis (TDA) is a recent and fast growing field providing a set of new topological and geometric tools to infer relevant features for possibly complex data. Here we propose a set of notebooks for the practice of TDA with the python Gudhi library together with popular machine learning and data sciences libraries. See for instance this paper for an introduction to TDA for data sciences.
The complete list of notebooks can also be found at the end of this page.
See the installation page or if you have conda you can make a conda install.
TDA typically aims at extracting topological signatures from a point cloud in
A simplicial complex is a set of simplices, they can be seen as higher dimensional generalization of graphs. They are mathematical objects that are both topological and combinatorial, a property making them particularly useful for TDA. The challenge here is to define such structures that are proven to reflect relevant information about the structure of data and that can be effectively constructed and manipulated in practice. Below is an exemple of simplicial complex:

A filtration is a increasing sequence of sub-complexes of a simplicial complex K, it can be seen as ordering the simplices included in the complex K. Indeed, simpicial complexes often come with a specific order, as for Vietoris-Rips complexes, Cech complexes and alpha complexes.
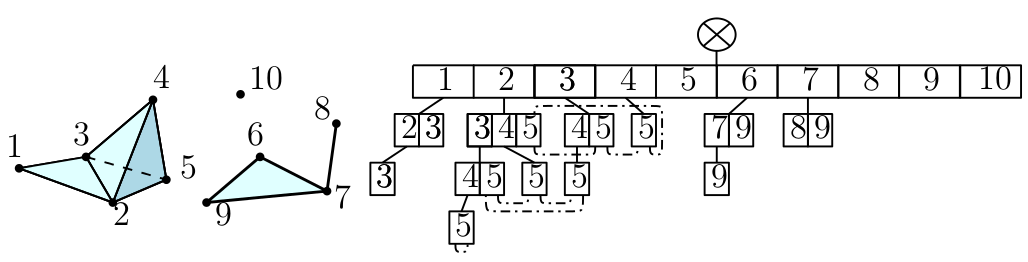
Notebook: Simplex trees. In Gudhi, filtered simplicial complexes are encoded through a data structure called simplex tree. The vertices are represented by integers, the edges by couple of integers etc.
Notebook: Vietoris-Rips complexes and alpha complexes from data points. In practice the first step of the "TDA pipeline analysis" is to define a filtration of simplicial complexes for some data. This notebook explains how to build Vietoris-Rips complexes and alpha complexes (represented as simplex trees) from data points in
Notebook: Rips and alpha complexes from pairwise distance. It is also possible to define Rips complexes in general metric spaces from a matrix of pairwise distance. The definition of the metric on the data is usually given as an input or guided by the application. It is however important to notice that the choice of the metric may be critical to reveal interesting topological and geometric features of the data.We also give in this last notebook a way to define alpha complexes from matrix of pairwise distances by first applying a multidimensional scaling (MDS) transformation on the matrix.
TDA signatures can extracted from point clouds but in many cases in data sciences the question is to study the topology of the sublevel sets of a function.

Above is an example for a function defined on a subset of
Notebook: cubical complexes. One first approach for studying the topology of the sublevel sets of a function is to define a regular grid on
Homology is a classical concept in algebraic topology providing a powerful tool to formalize and handle the notion of topological features of a topological space or of a simplicial complex in an algebraic way. For any dimension k, the k-dimensional "holes" are represented by a vector space Hk whose dimension is intuitively the number of such independent features. For example the 0-dimensional homology group H0 represents the connected components of the complex, the 1-dimensional homology group H1 represents the 1-dimensional loops, the 2-dimensional homology group H2 represents the 2-dimensional cavities...
Persistent homology is a powerful tool to compute, study and encode efficiently multiscale topological features of nested families of simplicial complexes and topological spaces. It encodes the evolution of the homology groups of the nested complexes across the scales.
Persistent homology is a powerful tool to compute, study and encode efficiently multiscale topological features of nested families of simplicial complexes and topological spaces. It encodes the evolution of the homology groups of the nested complexes across the scales. The diagram below shows several level sets of the filtration.

Notebook: persistence diagrams In this notebook we show how to compute barcodes and persistence diagram from a filtration defined on the Protein binding dataset. This tutorial also introduces the bottleneck distance between persistence diagrams.
For many applications of persistent homology, we observe topological features close to the diagonal. Since they correspond to topological structures that die very soon after they appear in the filtration, these points are generally considered as "topological noise". Confidence regions for persistence diagram provide a rigorous framework to this idea. This notebook introduces the subsampling approach of Fasy etal. 2014 AoS. An alternative method is the bottleneck bootstrap method introduced in Chazal etal. 2018 and presented in this notebook.
This notebook introduces the distance to measure (DTM) filtration, as defined in this paper. This filtration can be used for robust TDA. The DTM can also be used for robust approximations of compact sets, see this notebook.
Vietoris-Rips complexes and alpha complexes from data points
Rips and alpha complexes from pairwise distance
Persistence diagrams and bottleneck distance
contact : bertrand michel